USGS: Aggregate consumption up in fourth quarter 2018

Percentage change in the amount of construction aggregate produced and shipped for consumption in the United States each quarter from 2008 through 2018. All comparisons are versus the same quarter of the prior year. Information courtesy of USGS.
An estimated 599 million metric tons (Mt) of total construction aggregate were produced and shipped in the fourth quarter of 2018, a 5 percent increase compared to the same period of 2017, the U.S. Geological Survey (USGS) reports.
The estimated annual output of construction aggregate produced in 2018 was 2.37 billion metric tons (Gt), a 5 percent increase from 2017.
Estimates for consumption of construction aggregate in the fourth quarter of 2018 increased in seven of the nine geographic divisions compared with that sold or used in the same quarter of 2017. In the fourth quarter, production for consumption increased in 17 of the 40 states estimates of construction aggregate were made.
The five leading states in the fourth quarter of 2018 as reported by USGS were, in descending order of production: Texas, California, Pennsylvania, Ohio and Florida. The combined total production for consumption was 182 Mt – 30 percent of the U.S. total.
The estimated total annual production for consumption of construction aggregate in 2018 increased in 34 of the 50 states for which estimates were made.
The five leading states were, in descending order of total annual output for 2018 according to the USGS: Texas, California, Florida, Pennsylvania and Ohio. Its combined total annual output was 716 Mt, a 7 percent increase compared with 2017.
Crushed stone
An estimated 359 Mt of crushed stone were produced and shipped for consumption in the fourth quarter of 2018, a 5 percent increase compared to the same period of 2017.
The estimated annual output of crushed stone produced for consumption in 2018 was 1.41 Gt, a 4 percent increase from 2017.
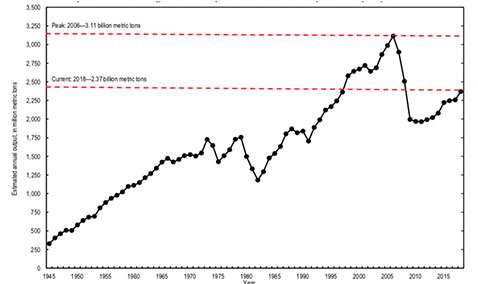
Estimated annual output of construction aggregate produced and shipped for consumption in the United States from 1945 through 2018. Information courtesy of USGS.
Estimated production for consumption of crushed stone in the fourth quarter of 2018 increased in seven of the nine geographic divisions compared with that sold or used in the fourth quarter of 2017, the report says.
Production for consumption increased in 25 of the 45 states for which production estimates of crushed stone were made.
Construction sand and gravel
The estimated output of construction sand and gravel produced and shipped for consumption in the fourth quarter of 2018 was 241 Mt, a 4 percent increase compared to the same period of 2017. Annual output of construction sand and gravel produced in 2018 was 961 Mt, a 7 percent increase from 2017.
The estimated production for consumption of construction sand and gravel in the fourth quarter of 2018 increased from 2017 in eight of the nine geographic divisions. Production for consumption increased in 21 of the 42 states.
About the Author: Joe McCarthy
Joe McCarthy is a former Associate Editor of Pit and Quarry Magazine.Subscribe to Pit & Quarry

If you enjoyed this article, subscribe to Pit & Quarry to receive more articles just like it.


