USGS: Aggregate production increases in third quarter 2018
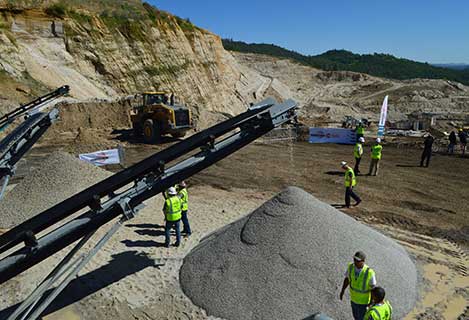
Aggregate production in the third quarter of 2018 was up 5 percent from the third quarter of 2017. Photo by Allison Barwacz
An estimated 694 million metric tons (Mt) of total construction aggregate were produced and shipped for consumption in the United States in the third quarter of 2018, the United States Geological Survey (USGS) reports. The 694 Mt total is a 5 percent increase compared with the third quarter of 2017.
For the first nine months of 2018, estimated construction aggregate production for consumption was 1.77 billion metric tons, a 5 percent increase from the same period last year.
The five leading states were, in descending order of production for consumption, Texas, California, Pennsylvania, Ohio and Minnesota. Their combined total production for consumption in the first nine months of 2018 was 497 Mt, a 6 percent increase compared to the same period from 2017.
Crushed stone
An estimated 405 Mt of crushed stone was produced and shipped for consumption in the United States in the third quarter of 2018, a 4 percent increase compared with the same time period last year.
Estimated production for consumption in the first nine months of 2018 increased 3 percent, compared with the first nine months of 2017, totaling 1.05 billion metric tons.
The five leading states were, in descending order of production for consumption, Texas, Pennsylvania, Florida, Ohio and Illinois. The combined total production for consumption of these five states for the first nine months of 2018 was 337 Mt, an increase of 4 percent from the same period last year and representing 32 percent of the U.S. total.
Construction sand and gravel
The estimated U.S. output of construction sand and gravel produced and shipped for consumption in the third quarter of 2018 was 289 Mt, an 8 percent increase compared with the third quarter of 2017.
For the first nine months of 2018, the estimated production and consumption of construction sand and gravel was 720 Mt, a 7 percent increase from the same period last year.
The five leading states were, in descending order of production for consumption, California, Texas, Minnesota, Michigan and Arizona. Their combined total production for consumption in the first nine months of 2018 was 269 Mt, a 14 percent increase from the same period last year and representing 37 percent of the U.S. total.
About the Author: Zach Mentz
Subscribe to Pit & Quarry

If you enjoyed this article, subscribe to Pit & Quarry to receive more articles just like it.


