Crushed stone, sand and gravel production holding steady

Texas, Florida, Missouri, Pennsylvania and Georgia were the top crushed stone-producing states during the first quarter of 2021. Photo: P&Q Staff
The U.S. Geological Survey reports that the nation’s crushed stone production dipped last year for the first time since 2017, but sand and gravel production – with the exception of the year prior – was as high as it’s been in the last 12 years.
Crushed stone and sand and gravel production slid in the second and third quarters of 2020, but both recovered in the fourth quarter last year.
Aggregate production was up at the very start of 2020 – before the pandemic set in. Crushed stone production rose slightly in the first quarter last year versus 2019’s first quarter, increasing to 291 million metric tons. Similarly, sand and gravel production jumped 6 percent in 2020’s first quarter versus the prior-year period to 173 million metric tons.
The effects of the pandemic, however, set in by the second quarter of 2020, leaving an imprint on aggregate production. Crushed stone production (404 million metric tons) dropped 2.3 percent in the second quarter, and sand and gravel production (255 million metric tons) slipped nearly 5 percent compared with the second quarter of 2019.
That narrative carried through the third quarter, with crushed stone production (416 million metric tons) dropping 6 percent and sand and gravel production (290 million metric tons) down 4 percent compared with the third quarter of 2019.
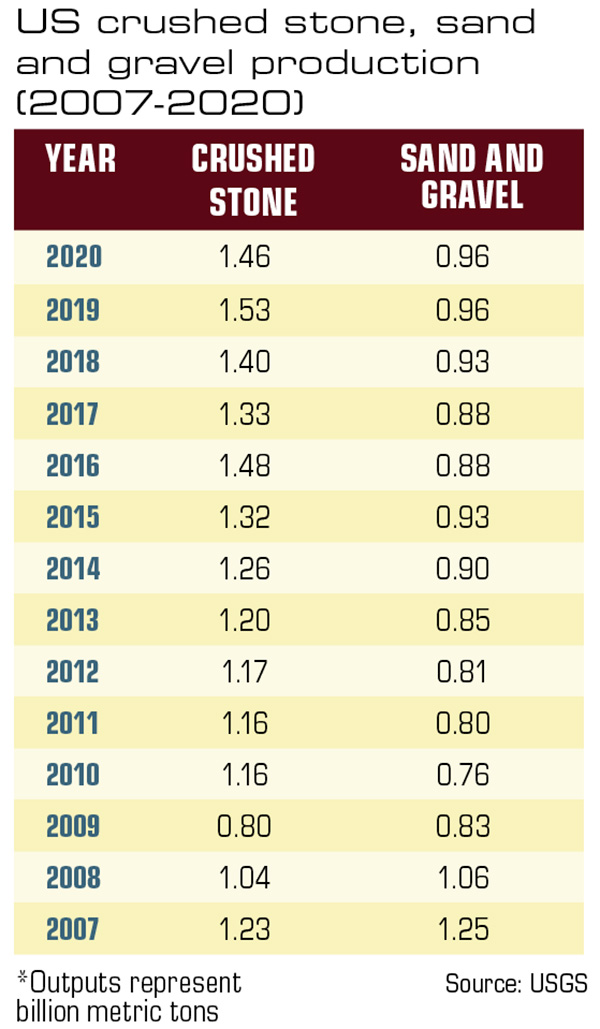
While crushed stone production totals have recovered since the Great Recession, sand and gravel production remains below 2007-08 levels. Click to expand.
2020 crushed stone production
According to USGS, 1.46 billion metric tons of crushed stone valued at more than $17.8 billion were produced during all of last year. USGS estimates that 1,410 companies operating 3,440 quarries and 180 sales and distribution yards combined to produce the 1.46 billion metric tons.
The states that produced the most crushed stone in 2020 were Texas, Missouri, Florida, Pennsylvania, Ohio, Georgia, Virginia, Illinois, North Carolina and Kentucky. These 10 accounted for more than half of the total crushed stone output, USGS says.
Of all domestic crushed stone produced in 2020, about 70 percent was limestone and dolomite; 15 percent was granite; 6 percent was traprock; 5 percent was miscellaneous stone; 3 percent was sandstone and quartzite; and the remaining 1 percent was divided, in descending order of tonnage, among marble, volcanic cinder and scoria, calcareous marl, slate and shell.
USGS also estimates that 72 percent of the crushed stone consumed in the U.S. last year was used as construction aggregate – mostly for road construction and maintenance. Sixteen percent was crushed stone used for cement manufacturing; 8 percent was for lime manufacturing; 2 percent was for agricultural uses; and the remainder was used for chemical, special and miscellaneous uses and products.
2020 sand & gravel production
2020 sand and gravel production across the U.S. came in at 960 million metric tons, according to USGS. The agency says the 2020 tonnage was valued at $9.2 billion, and that about 3,870 companies operating 6,800 pits and 340 sales and distribution yards produced the combined tonnage.
The top sand and gravel-producing states last year were California, Texas, Arizona, Minnesota, Michigan, Utah, Ohio, Washington, Colorado and New York, according to USGS. Together, the 10 accounted for about 53 percent of the nation’s total sand and gravel output.
Additionally, USGS says about 46 percent of the sand and gravel produced last year was used as portland cement concrete aggregate; 21 percent was for road base and coverings and road stabilization; 13 percent was for construction fill; 12 percent was for asphaltic concrete aggregate and for other bituminous mixtures; and 4 percent was for other miscellaneous uses. The remaining 4 percent was used for concrete products, filtration, golf course maintenance, plaster and gunite sands, railroad ballast, road stabilization, roofing granules, and snow and ice control.
2021 storyline
As P&Q went to press with the Market Reference Guide in June, the only 2021 production figures available from USGS were for the year’s first quarter.
According to USGS, an estimated 286 million metric tons of crushed stone were produced and shipped for consumption in the U.S. in the first quarter this year. That figure represents a slight decrease compared with production from the first quarter of 2020.
In sand and gravel, the estimated first-quarter output was 178 million metric tons. That 2021 figure is an increase of 6 percent compared with the first quarter of 2020.
About the Author: Kevin Yanik
Kevin Yanik is editor-in-chief of Pit & Quarry. He can be reached at 216-706-3724 or kyanik@northcoastmedia.net.Subscribe to Pit & Quarry

If you enjoyed this article, subscribe to Pit & Quarry to receive more articles just like it.


